
Resource Library
Whitepaper: A technical framework for 3D near-miss risk grading
By XVision Engineering
- Evidence Frameworks
- Safety Risk
- Location Intelligence
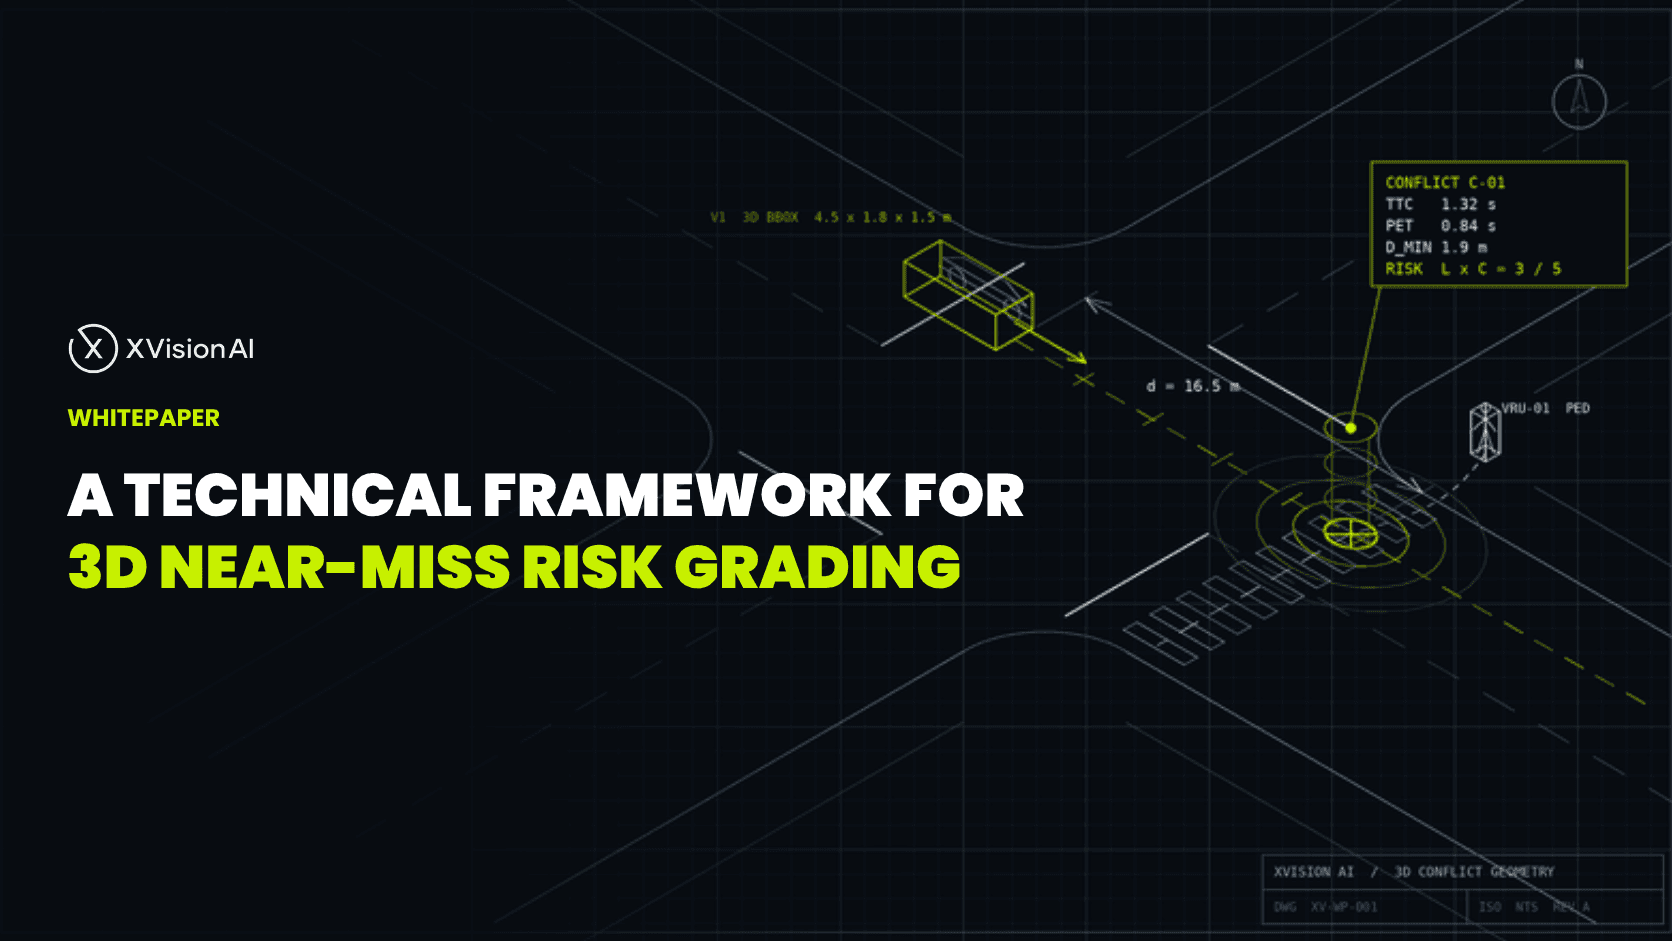
Whitepaper: A technical framework for 3D near-miss risk grading
Crash records describe what already went wrong. Proactive safety work needs something else: measured conflict exposure at the location, graded by likelihood and consequence.
Road authorities are adopting surrogate safety measures — Time-to-Collision (TTC), Post-Encroachment Time (PET), minimum separation — to see risk before the next crash. Those metrics only hold if the underlying trajectories are measured in real space and time. Many video platforms were built to detect road users in an image. Detection is not measurement.
XVision’s technical whitepaper From Detection to Measurement: A Technical Framework for 3D Near-Miss Risk Grading (Version 1.0, July 2026) sets out an engineering framework for that gap. This page is the public landing summary. The full paper is available to download.
Download the technical whitepaper (PDF)
The engineering principle
2D systems are designed to see the scene. 3D stereo systems are built to measure the scene.
A monocular camera projects the world onto a flat image. Depth is inferred — often through planar homography that assumes a flat road and a fixed camera pose. Real networks have grade, crossfall, vibration and vehicles that pitch under braking. Those assumptions break. Bounding-box centroids live in pixel space. They do not give surveyed X, Y, Z paths.
Stereo vision reconstructs depth by triangulation from two synchronised cameras with a known baseline. Coordinates are measured, not guessed from perspective. That is the foundation for engineering-grade trajectories — and for the surrogate metrics that depend on them.
Three pillars of the framework
The whitepaper builds consequence-aware near-miss grading on three complementary principles.
1. 3D spatial measurement
Stereo triangulation yields real-world coordinates for each road user. From those paths the system can derive speed vectors, path convergence angles, minimum separation, TTC, PET, braking onset and projected impact kinematics. The progression is deliberate: object detection (Level 1) → spatial trajectories → micro-kinematics → predicted impact → likelihood × consequence risk score. Each step adds measurement fidelity. Skipping to “near-miss counts” from 2D boxes alone leaves severity poorly grounded.
2. Deployment geometry
Mounting height is a design parameter, not a preference. Low mounts look through traffic. Larger vehicles occlude pedestrians and cyclists behind them. The paper’s similar-triangles model shows how occlusion length shrinks as height rises. For a representative 1.8 m blocking vehicle at 10 m range, raising the mount from 3.0 m to 8.0 m reduces projected ground occlusion from about 15.0 m to 2.9 m — roughly an 81% reduction. Continuity of trajectories through the conflict zone is what makes PET and TTC usable for prioritisation.
Site geometry still decides the practical height. The whitepaper treats 6.0 m as a strong balance for many intersections, with 5.0 m common on streetlight poles and trailer masts, and taller mounts trading resolution and structural demands for top-down visibility. Related reading on geometry first: Camera Placement for Near-Miss Detection.
3. 120 fps temporal sampling
Critical interactions often unfold in under 200 milliseconds. Frame rate sets how finely position, speed and braking can be reconstructed. At 50 km/h, displacement between frames is about 0.46 m at 30 FPS and about 0.12 m at 120 FPS. When closest approach falls between samples, interpolation adds uncertainty into separation and TTC. High-frequency sampling is a measurement requirement for transient dynamics — not an imaging luxury.
What the framework enables
Likelihood alone is not enough. A 1.2-second TTC between two slow merging vehicles is not the same risk as a 1.2-second TTC between a heavy vehicle and a pedestrian. The framework grades Risk = Likelihood × Consequence.
- Likelihood from TTC, PET and minimum separation.
- Consequence from projected impact velocity, impact angle and road-user vulnerability.
The risk matrix in the paper maps low / medium / high likelihood against low / medium / high consequence into actions from monitor and review through treat, priority treat and critical geometric redesign. That gives transport engineers a repeatable way to put limited capital on locations presenting the greatest overall safety risk — not the noisiest detection feed.
Deployment and validation
Measurement systems for engineering decisions need a staged path: site assessment and geometry → mobile height validation → shadow-mode calibration (typically seven to fourteen days) → engineering assessment and risk reporting. Validation targets in the paper include spatial position error, speed and heading tolerances, braking-onset latency at 120 FPS, TTC/PET estimation error, and classification stability — so outputs can sit beside surveyed references and controlled runs before they inform interventions.
For how XVision stages observation before response in live operations more broadly, see the Engineering Dossier.
Why this matters for road authorities
Proactive safety programs need location evidence that survives engineering review. Counts of “near misses” from image-space proximity do not. Measured trajectories, surrogate metrics with known uncertainty, and consequence-aware grading do. The whitepaper is the technical case for that shift — from detecting road users to measuring conflict risk at the places that matter.
Download the technical whitepaper (PDF)
XVision AI Systems · Technical Whitepaper · Version 1.0 · July 2026
Capabilities → Near-Miss & Conflict Analysis can cross-link to this page when that nav lane is updated.