
Resource Library
See whether it worked: closing Australia’s location-level road safety evidence loop
By Simon Maselli
- Road Safety
- school zones
- near miss
- National Road Safety Strategy
- before-after evaluation
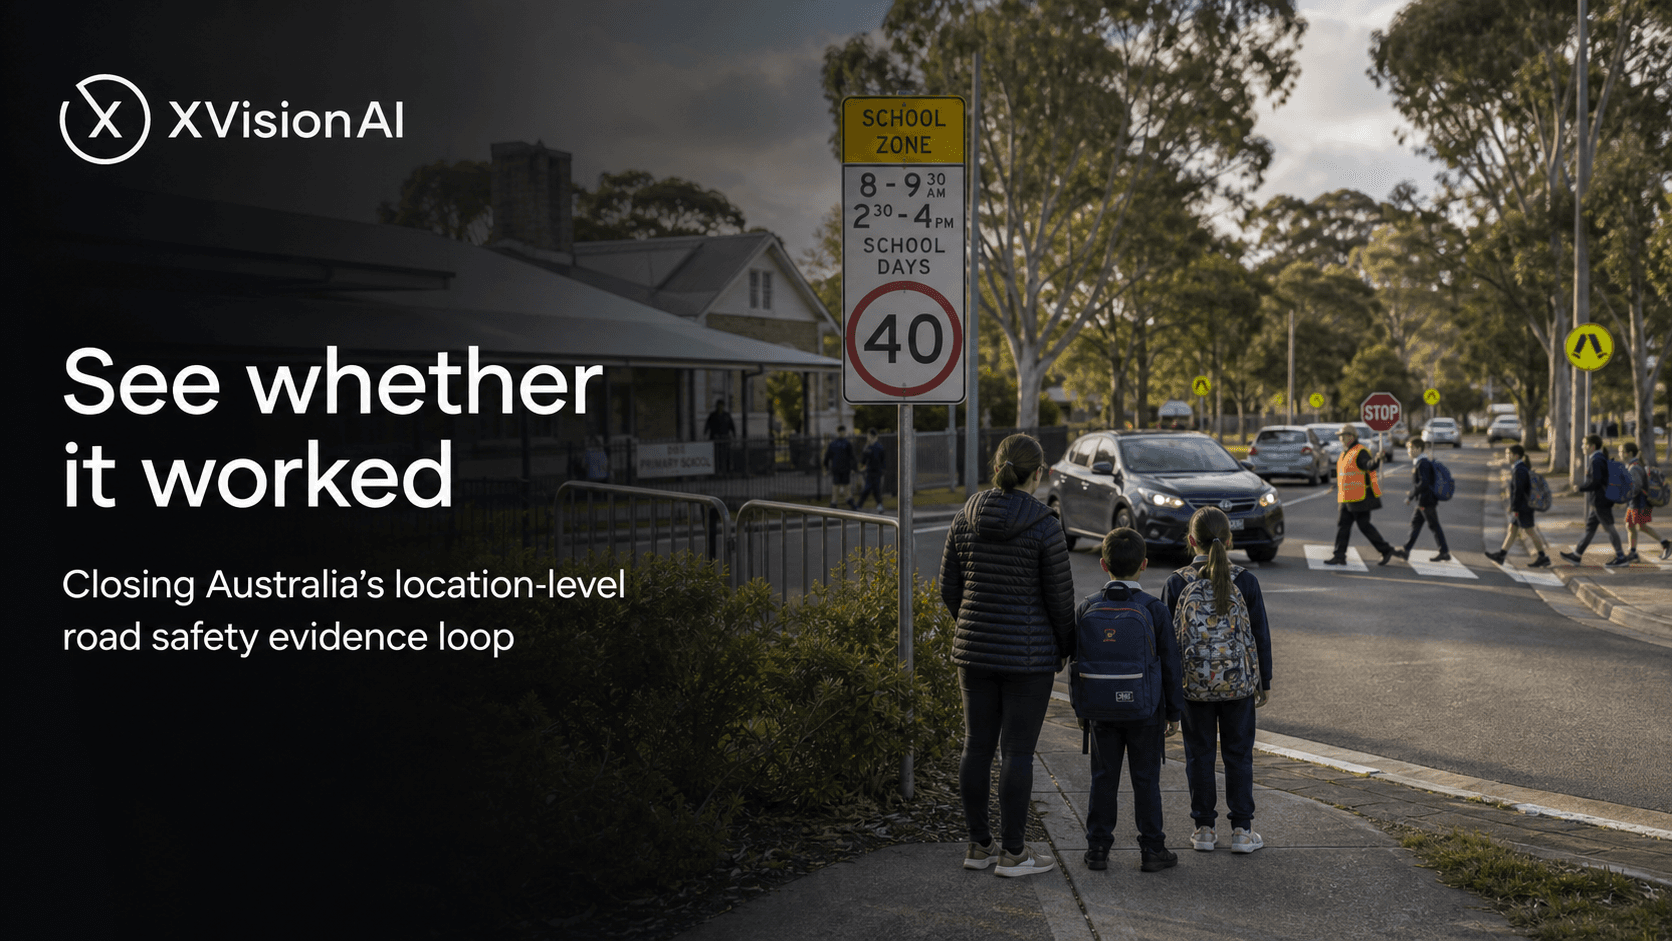
Australia’s National Road Safety Strategy 2021–30 set a clear destination: halve road deaths and cut serious injuries by 30 per cent by 2030, on the way to Vision Zero. Halfway through the decade, the destination is unchanged—but the gap to target has widened.
In 2024, 1,300 people died on Australian roads—42 more than in 2023, and the highest calendar-year toll in more than a decade (National Road Safety Data Hub / BITRE). By March 2026, the Australian Automobile Association’s benchmarking of the Strategy showed 1,326 deaths in the preceding 12 months: 16.1 per cent above the Strategy’s 2018–2020 baseline and 20.9 per cent higher than when the Strategy began. No state or territory was on track for the headline fatality target. Pedestrian deaths rose sharply in the same period. Serious-injury progress, meanwhile, remains largely unmeasurable at national scale because consistent data are still incomplete.
That national picture matters. It does not, by itself, tell a transport team what to do next Tuesday at Smith Street School Crossing, or whether last month’s worksite treatment on the Pacific Highway approach actually reduced risk. The Strategy’s challenge is not only ambition. It is the missing feedback loop between a question at a place, the evidence gathered there, the decision taken, the intervention delivered—and a clear view of whether the outcome changed.
Crash history is necessary. It is rarely enough.
Safe System thinking asks practitioners to manage risk before trauma occurs. Austroads’ updated Guide to Road Safety Part 2: Safe Roads (2024) reinforces that hierarchy: identify risk, choose treatments that reduce it, and plan monitoring and evaluation from the outset—including proactive approaches where crash samples are thin.
Crash-based evaluation remains essential. It is also slow and sparse at the locations where most day-to-day decisions are made. A council may wait years for enough injury crashes to appear at one school crossing or one filter right-turn lane. Local Government NSW has reported that some councils face delays of up to two years before crash data are timely and detailed enough for local action. ALGA notes that councils manage around 75 per cent of Australia’s road network—more than 650,000 km—and that roughly half of fatal crashes occur on local roads. The people closest to the problem often have the least continuous evidence about how a specific place is performing.
Waiting for the next crash is not a monitoring plan. It is a lag indicator with a human cost.
Australian practice is already moving to conflicts and before–after evidence
Research and agency practice in Australia are quietly answering that gap with location-level observation—especially traffic conflicts, near-misses and structured before–after evaluation.
In Cairns, Queensland researchers used video analytics across 654 hours of footage at five signalised intersections to evaluate a part-time protected right-turn strategy. Using conflict measures such as post-encroachment time, they estimated substantial reductions in severe and non-severe opposing-through crash risk after the treatment (Howlader et al., Accident Analysis & Prevention, 2024). The study’s value is not only the result. It is the method: treat a specific location, observe the same place before and after, and quantify whether risk changed without waiting a decade for crash counts.
Transport for NSW has trialled deployable near-miss detection to support Towards Zero, reporting hundreds of near-misses at trial sites within weeks—evidence that can inform site-specific design long before a serious crash appears in the database (Australasian Road Safety Conference, 2023). In temporary traffic management, an iMOVE study with Transport for NSW and Deakin University trialled end-of-queue treatments across 13 NSW roadworks zones, collecting speed, near-miss video and driver feedback over 116 days, then analysing results with before–after methods. The report is explicit about a practical limit: short trials struggle to separate lasting effect from novelty. Longer observation at the same worksite is needed if agencies want to know what still works after the first fortnight.
These are not arguments for replacing SCATS, STREAMS, CCTV, connected-vehicle feeds or established ITS platforms. They are arguments for continuity of evidence at the place where a decision is made—alongside the systems already running the network.
School zones and worksites expose the same pattern
Vulnerable road users make the evidence gap concrete. National trauma reporting shows pedestrians and motorcyclists among the groups with significant fatality increases in recent years. School travel remains a political and operational priority for good reason: children are exposed in short, intense windows at known locations.
NRMA’s school safety work in NSW shows long-term improvement in child trauma during school travel periods, while still pressing that a camera or a posted limit is not “job done.” Transport for NSW’s 2025 Wallsend South Public School trial of adaptive school-zone alerts is framed around a practical learning question: which messages and conditions change driver behaviour, and which zones need further treatment? That is a location workflow, not a network slogan—compare vehicle and pedestrian activity, test a change, see what moved.
Roadworks tell a parallel story. Temporary layouts create new conflict patterns overnight. Councils and contractors already know temporary traffic management is high consequence; what they often lack is a continuous record that answers three plain questions: what happened before the layout changed, what changed after, and did the treatment hold?
Named places make the workflow tangible. At Riverside Primary School Crossing, the question may be whether afternoon peak speeds and near-side conflicts justify a raised crossing or a kerb extension. At Harborne Road / Station Street, the question may be whether a filter right-turn phase is producing recurring opposing-through conflicts. At a Pacific Motorway shoulder worksite near Beenleigh, the question may be whether an end-of-queue warning package reduced excess speed and rear-end risk after night shift began. Different products and sensors can serve those questions. The constant is the location as the unit of learning.
What “good” looks like for decision-makers
A practical evidence loop for Australian transport teams is not exotic. It looks like this:
- Question — What is happening at this location, for which road users, in which hours?
- Evidence — Observe the place with enough continuity to separate noise from pattern—conflicts, speeds, compliance, exposure—not only annual crash extracts.
- Decision — Choose a treatment that fits Safe System hierarchy and local constraints, informed by what the location actually shows.
- Intervention — Deliver the change: engineering, operations, enforcement where type-approved, education, or temporary management.
- Outcome — Return to the same location and ask whether risk and behaviour moved. Keep watching long enough to learn whether the effect persisted.
That loop respects coexistence. Permanent cameras, temporary observers, portable enforcement-class systems, and existing ITS can each contribute evidence without pretending one platform replaces the rest. The organisational habit that matters is continuity: the same place, before and after, with a clear definition of “worked.”
National Strategy targets will not be met by more narratives alone. The National Road Safety Annual Progress and Data Report has already noted incomplete Safety Performance Indicator reporting and the need for better harmonised data. Closing the national gap starts, in practice, at places with names: school crossings, filter turns, worksites, event detours and local high streets where councils and state agencies must act with incomplete trauma data and limited investigation capacity.
Closing the loop
Australia does not lack treatments. It lacks a reliable habit of proving, at the location, whether a treatment did what was intended. Crash databases remain indispensable. They are not a substitute for continuous, place-based evidence that can answer traffic questions in weeks rather than years—and that can show whether an intervention held after the ribbon was cut.
See what happened. See what changed. See whether it worked.
That is how Safe System intent becomes operational learning—one location at a time.
XVision works with transport teams on location-centric road intelligence: understanding a place, gathering evidence, supporting decisions and interventions, and helping prove outcomes—alongside the ITS and data systems agencies already use. Traffic questions, answered.
Sources
- National Road Safety Data Hub — Annual trauma (2024: 1,300 deaths). https://datahub.roadsafety.gov.au/progress-reporting/annual-trauma
- Bureau of Infrastructure and Transport Research Economics (BITRE) — Australian Road Deaths Database. https://www.bitre.gov.au/statistics/safety/fatal_road_crash_database
- Australian Automobile Association — Benchmarking the Performance of the National Road Safety Strategy, March Quarter 2026. https://www.aaa.asn.au/wp-content/uploads/2026/04/AAA_QBR_March_2026_web.pdf
- National Road Safety Strategy 2021–30 — Performance monitoring fact sheet. https://www.roadsafety.gov.au/nrss/fact-sheets/performance-monitoring
- Office of Road Safety — National Road Safety Annual Progress and Data Report 2023. https://www.roadsafety.gov.au/sites/default/files/documents/national-road-safety-annual-progress-and-data-report.pdf
- Austroads — Guide to Road Safety Part 2: Safe Roads (AGRS02-24, July 2024). https://austroads.gov.au/publications/road-safety/agrs02
- Howlader, Ali, Burbridge & Haque (2024) — Before-after safety evaluation of part-time protected right-turn signals… Accident Analysis & Prevention. https://eprints.qut.edu.au/244178/
- TfNSW / Real Time Traffic near-miss trial — summarised in Australasian Road Safety Conference proceedings / TRID record. https://trid.trb.org/View/2431411
- iMOVE Australia with Transport for NSW & Deakin University — Roadworks zones: Increasing safety for roadworkers and drivers (Working near traffic: Work zone end of queue study). https://imoveaustralia.com/project/project-outcomes/roadworks-zones-increasing-safety-for-roadworkers-and-drivers/
- Australian Local Government Association — Roads and infrastructure policy (local roads ~75% of network; local-road trauma share). https://alga.com.au/policy/roads-and-infrastructure/
- Local Government NSW — Submission: Interventions to reduce road trauma in regional NSW (crash data timeliness/detail). https://www.parliament.nsw.gov.au/ladocs/submissions/90760/Submission%20014%20-%20Local%20Government%20NSW.pdf
- Inside State Government / Transport for NSW — Smart school zone trial, Wallsend South Public School (2025). https://www.insidestategovernment.com.au/transport-for-nsw-gets-smart-on-school-zone-safety/
- NRMA — School’s in school safety report. https://www.mynrma.com.au/-/media/nrmaheadless/files/cs-2599---school-safety-report-d8.pdf
- The Guardian (27 Jan 2025) — Australia’s 2024 road toll of 1,300. https://www.theguardian.com/australia-news/2025/jan/27/australia-road-toll-2024-1300-deaths-highest-in-more-than-a-decade