
Resource Library
School-Gate Safety Is a Location Problem
By Simon Maselli
- school crossings
- pedestrian safety
- local roads
- Safe System
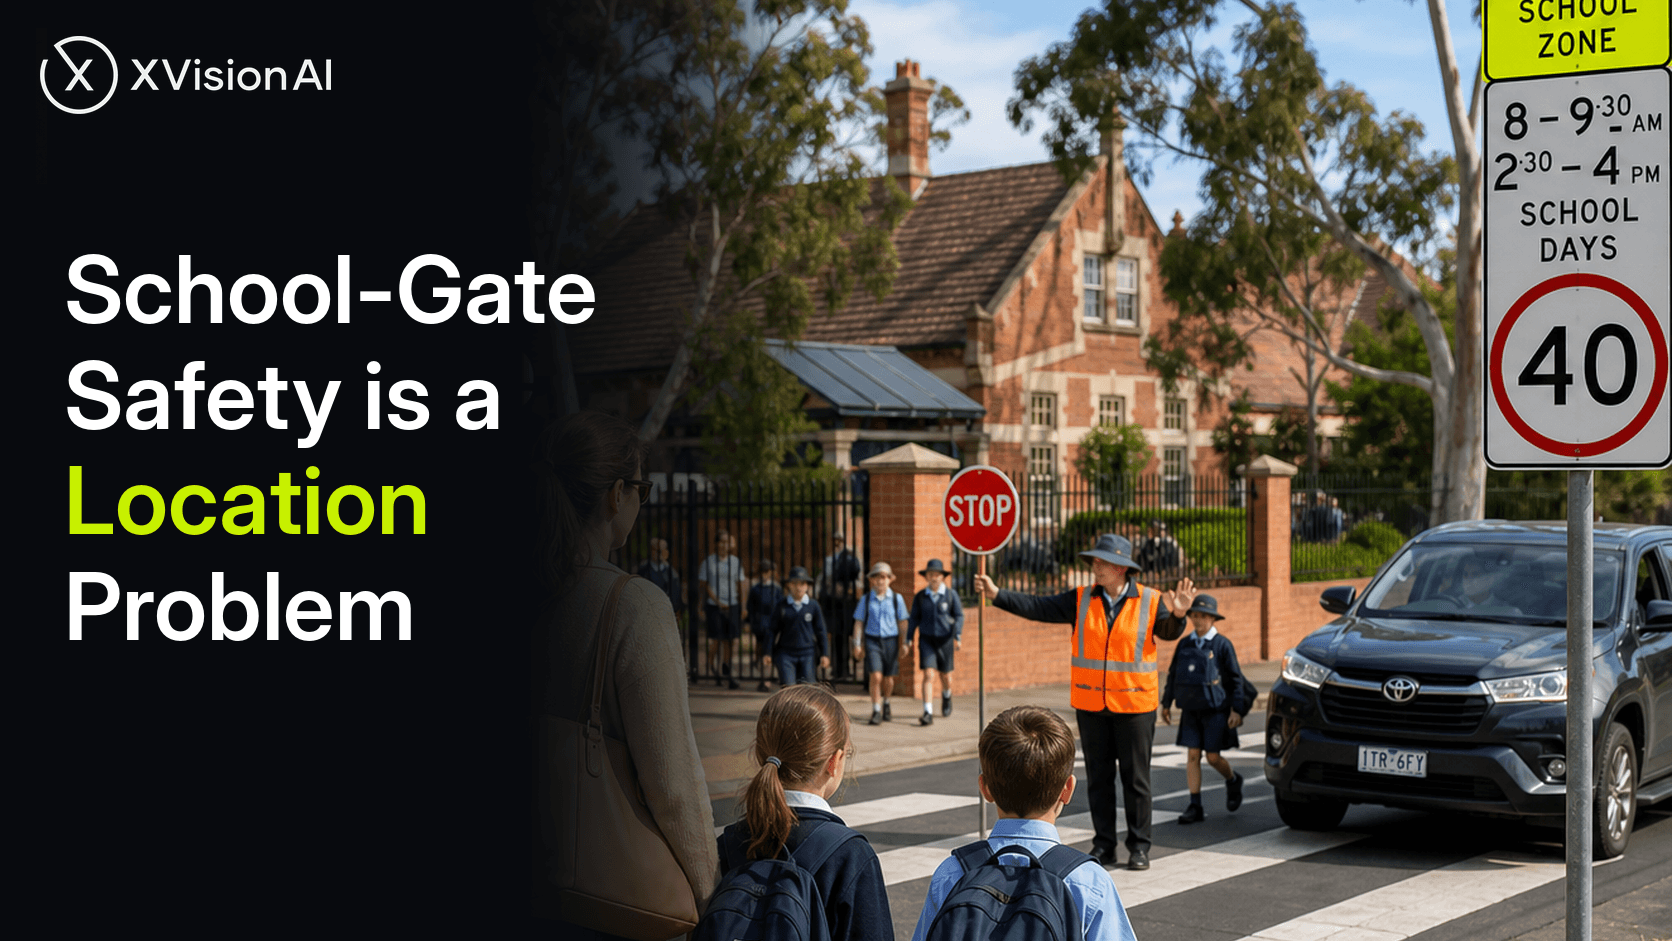
Australia is in the middle of the largest coordinated school-crossing upgrade in a decade. Western Australia has put 40 km/h on every children's crossing outside a school zone. South Australia is rolling 40 km/h precincts onto arterial roads beside more than 150 schools. Queensland is expanding supervised crossings. New South Wales is funding raised platforms at the school gate. Pedestrian deaths, meanwhile, are rising. The gap is not another program. It is the ability to treat each school crossing as a location — to ask what is happening here, decide what to do, see what changed, and compare it with the rest of the network.
The program wave is real. The location picture is not.
In August 2025, Main Roads Western Australia reported 40 km/h speed zones in place at all 140 children's crossings found outside existing school zones or 40 km/h areas, inside a $10 million program. Named locations include Orrong Road near Corser Street in the Town of Victoria Park and Bussell Highway near Johnston Avenue in West Busselton. The limit applies on school days from 7.30 am to 9.00 am and 2.30 pm to 4.00 pm.
South Australia is closing a different gap. The state already had 25 km/h school zones on local streets whenever a child was present, and little equivalent on the arterial roads where many students actually cross. From November 2025, time-based 40 km/h precincts began going onto those roads, with more than 150 schools in scope by late 2026, starting with Kensington Road near Marryatville High School.
Queensland added 37 new school crossing supervisors at 33 schools in 2025–26, taking the scheme past 1,400 crossings. New South Wales already runs 40 km/h school zones on notified school days, and Get Kids Active is converting at-grade crossings into raised platforms — including Adelaide Street at West Ryde Public School. Victoria is delivering more than 850 pedestrian crossings inside a $1.4 billion road-safety program, against 52 pedestrian deaths in 2025, well above the five-year average of 39.
This is a national treatment wave aimed at the same class of place: the school gate and the last 200 metres of the walk to school. A program can count signs installed and supervisors rostered. It cannot tell a road safety engineer whether Orrong Road behaves like Kensington Road, or whether the raised platform on Adelaide Street changed anything that mattered at 8.15 am.
Crash history is the wrong clock for a school gate
The National Road Safety Strategy 2021–30 asks governments to halve road deaths by 2030 and to reach zero deaths of children aged seven years and under. Halfway through the decade the trajectory is going the other way. In the 12 months to 31 March 2026, 1,326 people died on Australian roads — 3.0 per cent higher than the previous corresponding period, and 20.9 per cent higher than when the strategy began. Pedestrian deaths rose 16.4 per cent, to 199. Deaths of children aged seven and under rose from 17 to 25.
Those figures are not a school-crossing statistic. They are the context in which school-gate investment is being made. Pedestrian deaths had already risen 48.6 per cent from 2021 to the 12 months ending July 2025. The Strategy's own evidence base is blunt about speed: an unprotected road user has an estimated 10 per cent probability of being killed if struck at 30 km/h, rising to more than 90 per cent at 50 km/h. Most pedestrian deaths occur in 50–60 km/h zones. That is why the 40 km/h treatments exist — and why crash history is a poor clock here. A children's crossing is used for two short windows on school days. A five-year casualty extract can look quiet at a site where hundreds of children cross every weekday.
Austroads' Keeping People Safe When Walking reports (March 2025) put a number on both the opportunity and the constraint. Fully implementing proven pedestrian interventions could reduce fatalities and serious injuries by 70–90 per cent. The same project set out 54 interventions and a separate data-improvement report, because exposure and safety performance indicators remain too weak to prioritise well. The school gate is where that gap is most expensive: high pedestrian intensity, mixed traffic, a short operating window, and a treatment program already rolling.
What the evidence has to show at 8.15 am
The useful question at a school crossing is not “is this a blackspot?” It is: what is happening at this location during the hours the treatment is meant to work?
On Murray Road in Coburg, Merri-bek Council has recorded 23 crashes in three years, including five serious injuries, on a corridor that serves a high school and a childcare centre. The speed limit has already been cut from 60 km/h to 40 km/h during school drop-off and pick-up. Crash totals describe the corridor. They do not describe whether students cross at the signed point or mid-block, whether drivers yield, or whether the 40 km/h window matches the actual arrival peak.
The same questions apply after treatment. On Kensington Road, 992 drivers were fined for exceeding the new 40 km/h precinct across 11 school weeks from late 2025 into Term 1 2026. That is an enforcement result, not a crossing outcome. It does not show whether approach speeds fell for the vehicles that were not fined, or whether students stopped using an unsigned gap 40 metres away. On Adelaide Street in West Ryde, the raised platform is also meant to calm traffic. The after picture is not automatic.
Existing systems are necessary and still insufficient. SCATS and STREAMS describe the signalised network around the school, not the unsignalised children's crossing on the side street. CCTV confirms an incident after it is reported. Connected-vehicle data describes circulating traffic, not the desire line from the school gate to the bus stop. None of that substitutes for location evidence at the crossing itself: who uses it, at what speed vehicles arrive, whether the signed crossing is the one people actually use, and what changed after the treatment went in.
Question, evidence, decision, outcome, benchmark
Once the location is visible, the workflow is the one a competent traffic engineer already uses. It is simply rarely closed.
Question. Is this the crossing students use, or the crossing we signed? Does the 40 km/h window cover the actual peak?
Evidence. See what happened at that location across a run of school mornings and afternoons. Separate the school-time peak from the rest of the day. Put the pedestrian desire line, the vehicle approach and the conflict points on the same picture.
Decision. Choose the treatment that matches the location: a time-based 40 km/h precinct on the arterial, a raised platform on the local street, a dual crossing, a supervisor, a kerb extension, or a combination. The missing input is which item this location actually needs.
Intervention. Deliver it through the program that already exists — Main Roads' children's crossing program, South Australia's precinct rollout, Queensland's supervisor expansion, Get Kids Active, a council capital job — without treating the program itself as the proof.
Outcome. Go back to the same location and see what changed. Did approach speeds fall inside the signed hours? Did students stop crossing mid-block? A sign installed is an output. A change in how the location behaves is an outcome.
Benchmark. Compare this school gate with the others on the same network. A 40 km/h precinct that works on Kensington Road and fails on a similar arterial is a design and operations question. A raised platform that calms Adelaide Street but not a similar local-street crossing tells the next funding round where to spend.
Location-level before-and-after is the only evaluation clock that matches the school year. The unit of work is not “school zones” as a category. It is Orrong Road near Corser Street, Kensington Road near Marryatville, Adelaide Street at West Ryde, Murray Road in Coburg. Averages do not cross the road at 8.15 am. Locations do.
XVision is built for that workflow. It is a location-centric road intelligence platform: understand a road location, decide what to do, prove whether it worked, and benchmark across the network. At a school gate, that means seeing what happened in the drop-off window, what changed after the 40 km/h zone or the raised platform went in, and how this crossing sits against the rest of the school-gate estate — alongside SCATS, STREAMS, CCTV, probe data and the ITS already in the field, not instead of them.
Sources
- Main Roads Western Australia, “School Zones and Children's Crossings Improvement Program”: https://www.mainroads.wa.gov.au/about-main-roads/what-we-manage/speed-zoning/school-zones-and-childrens-crossings-improvement-program/
- Government of Western Australia, “Major improvements to school crossing safety delivered” (14 August 2025): https://www.wa.gov.au/government/media-statements/Cook%20Labor%20Government/Major-improvements-to-school-crossing-safety-delivered-20250814
- Government of South Australia / WE ARE.SA, “First of more than 150 new 40km/h school zones begins” (10 November 2025): https://www.weare.sa.gov.au/news/First-of-more-than-150-new-40kmh-school-zones-begins
- RAA, “Drivers reminded about 40km/h school speed limits”: https://daily.raa.com.au/media-resources/drivers-reminded-about-40km-h-school-speed-limits/
- Queensland Government, “More school crossing supervisors to increase safety for Queensland kids” (23 January 2026): https://statements.qld.gov.au/statements/104357
- Transport for NSW, “School zones”: https://www.transport.nsw.gov.au/roadsafety/community/schools/school-zones
- NSW Government, “Get Kids Active funding recipients”: https://www.nsw.gov.au/driving-boating-and-transport/get-kids-active/funding-recipients
- Transport Accident Commission, “Lives Lost – Annual”: https://www.tac.vic.gov.au/road-safety/statistics/lives-lost-annual
- ABC News, “Calls to improve pedestrian safety in Victoria after increase in deaths” (20 July 2026): https://www.abc.net.au/news/2026-07-20/push-to-improve-pedestrian-safety-road-crossings-footpaths-vic/106928628
- Australian Automobile Association, Benchmarking the Performance of the National Road Safety Strategy: March 2026: https://www.aaa.asn.au/wp-content/uploads/2026/04/AAA_QBR_March_2026_web.pdf
- Office of Road Safety, National Road Safety Strategy 2021–30: https://www.roadsafety.gov.au/nrss
- Office of Road Safety, “Fact sheet: Evidence supporting the priority focus areas”: https://www.roadsafety.gov.au/nrss/fact-sheets/priority-focus-areas
- Austroads, “Keeping People Safe When Walking – Stream 1: Recommended Pedestrian Safety Interventions” (AP-R730-25, 21 March 2025): https://austroads.gov.au/publications/road-safety/ap-r730-25
- ABC News, “National road safety data shows pedestrian deaths have increased by almost 50 per cent since 2021” (20 August 2025): https://www.abc.net.au/news/2025-08-20/australian-road-toll-pedestrian-deaths-rise/105678436